Purpose
This function can be used to perform Profit and Loss Analysis from the figures held in the General Ledger system. It is designed to be used with the Online Cube to provide the figures in a tool where they can be analysed more interactively. However the Excel/CSV/Text file options can also allow users to extract the base data for use in another tool.
Data Input
Step 1 – Report Month
Month
Select the month required for the analysis. All GL figures for that month, or up to and including that month can then be used for analysis.
Values to show
Select whether you want to analyse Actual values, Budget values or both sets of figures.
Return to the Top
Step 2 – Report
You have the option to review 4 different types of profit and loss figures as follows:
- Monthly Details – shows the P&L for each month up to the month selected
- Quarterly Details – shows the P&L for each quarter in the current year
- Month To Date – shows the P&L for the month selected only
- Year To Date – shows the P&L for the current year up to the month selected
Notes on Cube use
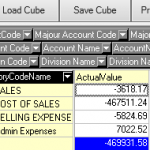
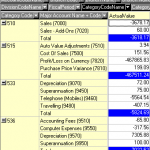
If you are using the Cube for the analysis of P&L data then you will find the data appears in the same sequence as the standard system P&L reports if you place the ‘CategoryCodeName’ element in the 1st column of the cube so that everything else to the right of that column is shown in category code sequence (as per screen shot).
As an  alternative to this approach you could use the ‘CatagoryCode’ as the 1st column if you’re already familiar with the GL categories, and then insert Major or Minor Chart of Account columns, or even the ‘CategoryName’ column after that depending on the detail you want to analyse. Of course if you’re not after the category totals and are only interested in the account balances/movements then you can use those columns without the need for categories.