Overview
Online Advantage has a built-in analysis tool called the “Cube”. We provide facilities with the system to send your data from reports or displays into the Cube so that you can explore and analyse the information within as required. The data in your system has many relationships that can be viewed in an almost infinite number of ways, depending on what angle you are looking from, and what information you are seeking. The Cube is designed to let you navigate your data and these relationships so that you can unlock the many secrets and lessons that lay within your data.
The Cube was given its name because of its ability to deal with multiple dimensions of data. However there are many other “industry” terms used to describe what the Cube does, including Data Mining, Business Intelligence (BI), Pivot Table, Slice & Dice Tool, OLAP (Online Analytical Processing), Drag & Drop Tool and others. They all essentially provide a way of dealing with multiple data dimensions/elements at one time. Note that there is only a theoretical limit to the number of dimensions the Cube can handle.
When data has relationships you need to look at it from different points of view. Traditionally this mean having many different report formats to view/print the data. The data itself might have been the same e.g. Sales Values, Costs, Margins/Mark-ups, etc. but you might have wanted to look at it by Sale Rep one minute, and by Customer Buying Group the next. On a flat page or screen, representing this type of data can be difficult due to the limitations of the static 2 dimensional row/column model.
With the Cube you can do all this and more dynamically. On the “fly” as you decide what it is you want to see. Every time you change the view in the Cube, the numeric data is re-totaled as appropriate for the new view. The Cube essentially becomes a dynamic calculator as you change view, allowing you to move data elements around and see the results. Of course it is much more than a dynamic calculator, but that is the essence of what it is doing.
The nature of the Cube is such that the relationships in the data are pre-established as the report or display data is moved into the Cube. All the user has to do is determine what data “elements” they want to bring into the Cube, and move them in as either a column or a row. Cubes can start off very simple, with just one line of totals for the numeric data involved. Then as the user decides to move the data elements onto the page, the Cube will build-up in complexity and the navigation of the data becomes more complex. Importantly the more complex the Cube, the more detail and lessons to be learnt from the data being analysed.
Feature Summary
Online Advantage’s analytical Cube tool enables you to analyse different dimensions of your multi-dimensional data. You can perform as much interactive analysis as you need using the facilities summaried below:
- Drag & Drop (Slice & Dice)
- Pivoting – dimensional data
- Data Filtering – in real-time
- Drill-Down – for multiple detail levels
- Roll-Up – for summary level data
- Splitter Bars – vertical & horizontal
- Ranking/Sorting – ascending & descending
- Print & Print Preview
- Save & Load Cubes
- Excel Export
- HTML Export
Drag & Drop and Pivoting
The ability to Drag & Drop (or Slice & Dice) the data elements that are available in a Cube is fundamental to the way they work. Our Cube shows the core “data” elements at the top of the display in dark grey as seen below. When these elements appear at the top they are “parked” and so do not appear within the Cube. The 1st image below shows a Cube that has all it’s elements parked, so only one line of totals appears.
These data elements can be moved around from being “parked” to being a “row” or a “column” in the Cube display. Also important to know that columns and rows are sequenced from left to right so moving a column to the left increases its “importance” in the total and multi-dimension view as you pivot them. The results of dragging and dropping and pivoting data elements can be seen in the screen shot below:

Ranking/Sorting
The ability to perform Sorting operations on the data in the Cube so that you can Rank data elements by the figures being shown is provided within the “Field Settings” button. Ranking is simple. Just select the data element you want to rank (e.g. Customer Category) and then select the column data you want to sort it by (e.g. Last Year Contribution) and the Cube will do the rest as per the example below.
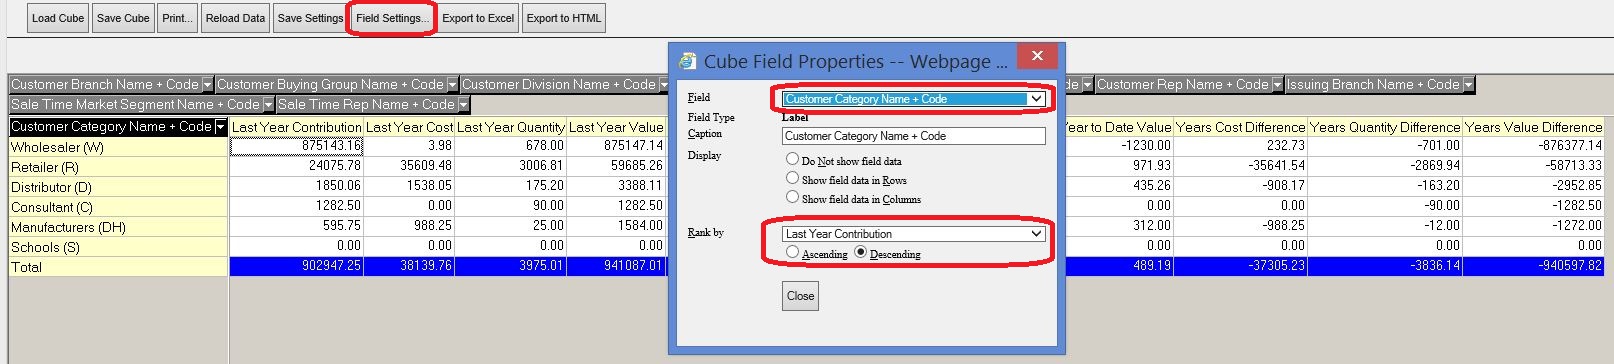
Note that with the Cube, you can have different sorting criteria within each of the data elements (rows or columns) to enable different ranking per element.
Filtering
One of the simplest and most powerful features of the Cube is its real-time filtering capability. The values being displayed on a Cube can be altered by adjusting the data filters on any/all of the main data elements in the Cube. It is simply a tick of the box to include/exclude a data item, and all the values that relate to it. This can lead to all sorts of “what-if” type analysis. It really turns the Cube into a dynamic real-time tool for data analysis. Sample below:
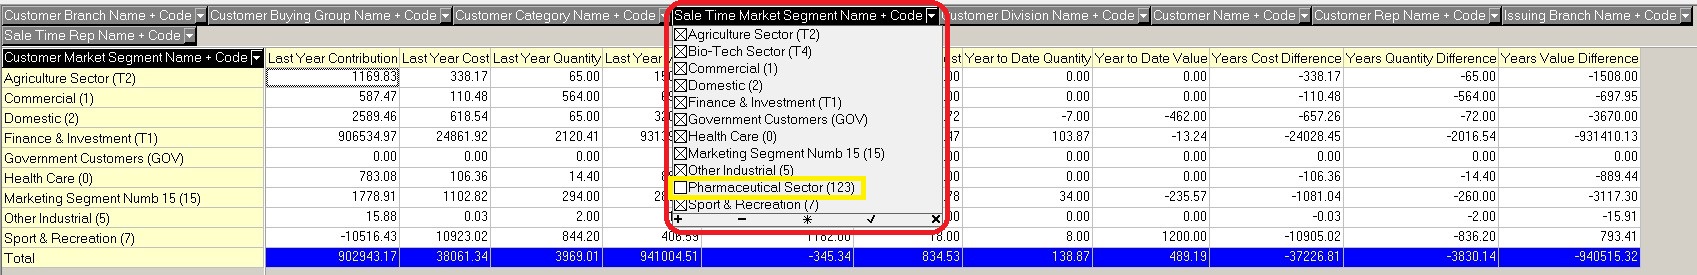
Important to note that even though a data element might be “parked” and not shown in the main Cube display, it is still available for filtering use as you work with a Cube. This gives you the ability to filter with criteria related to the data set you are working on but without the need to include it in the row or columns of the display.
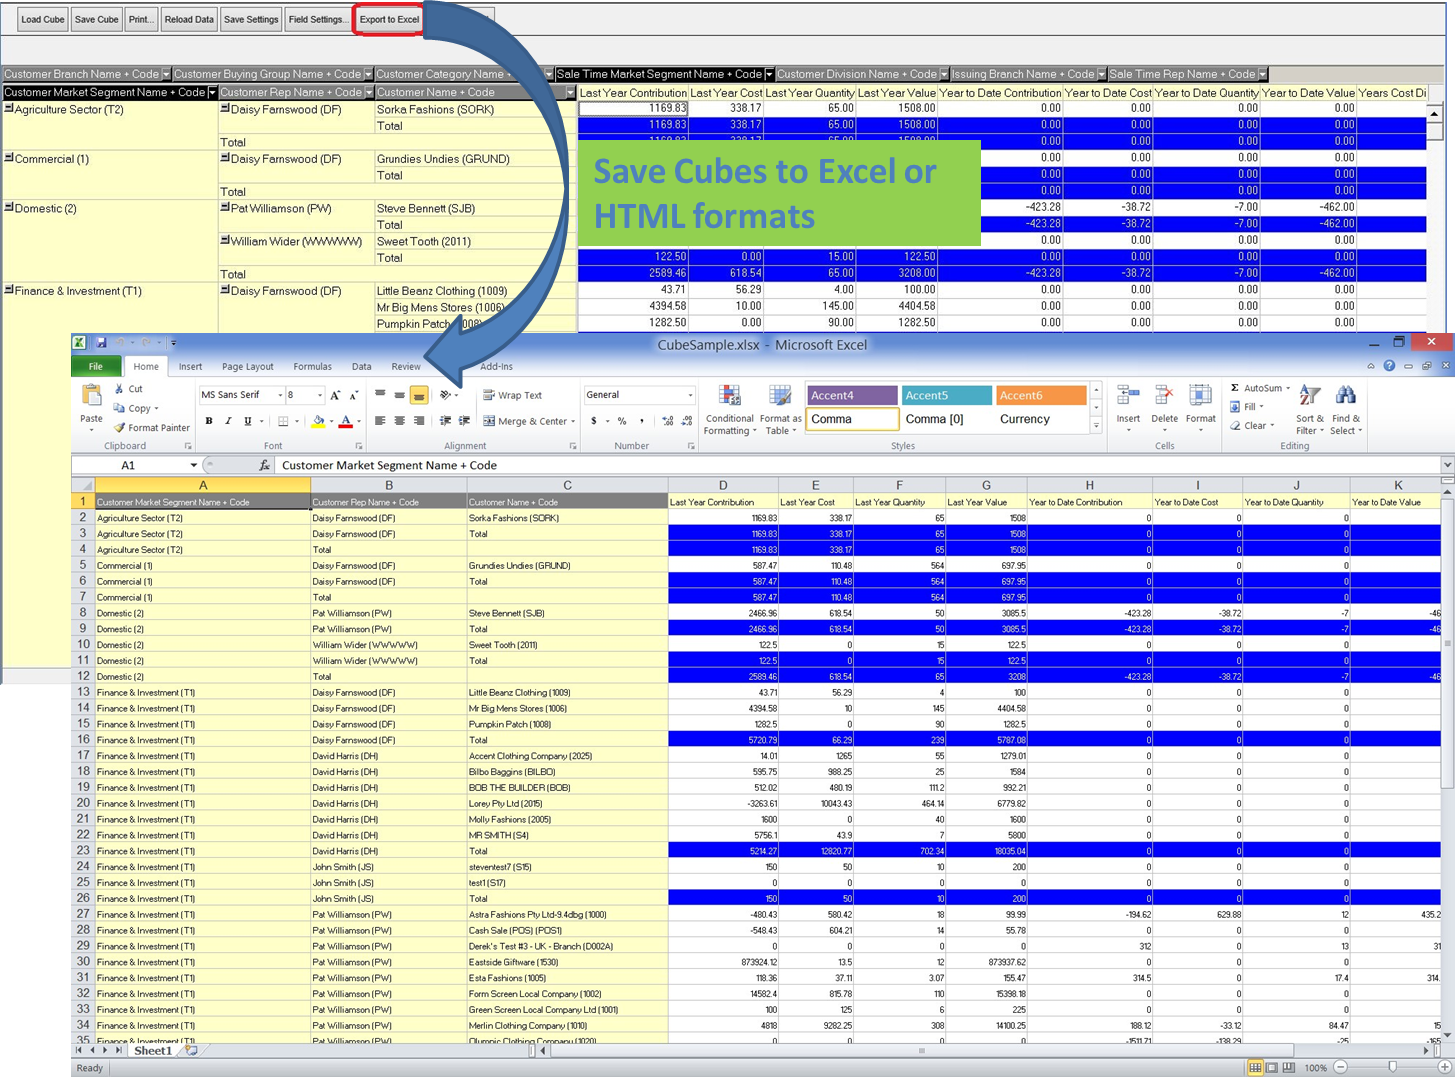
Export to Excel
When you have a Cube view of the data just the way you want it, not only can you save that Cube to your local disk storage, but you can also save the Cube in Excel format. This gives you the ability to take the raw data right from the Cube into Excel for further manipulation, or publishing in internal reports. The data saved to the Excel (or HTML) format will be an exact representation of the data as shown in the Cube at the time you perform the save. Only the Rows/Column data you had visible at the time, with the filters and ranking as you had them set, will be exported to the Excel file format as per the sample below: