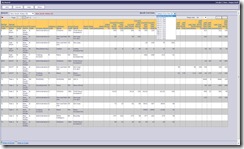
This new Sales Display is designed to allow users to see a range of sales “actual” figures across the key analysis elements in the system in a summarised screen display. Users can select from any of these 5 main display functions:
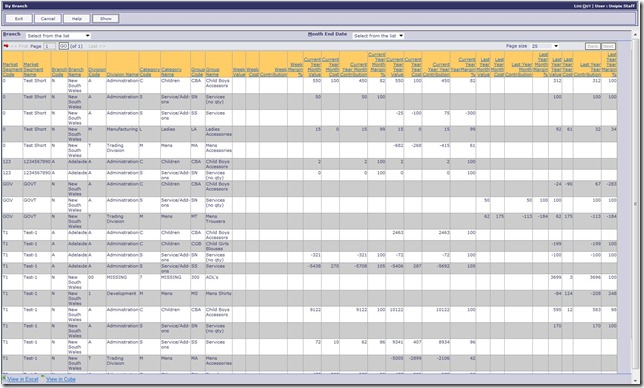
Within each of these displays, users then can see all data, or select from the prompts on the screen to target certain information. Sample below shows a Branch display showing details for all Branches available:
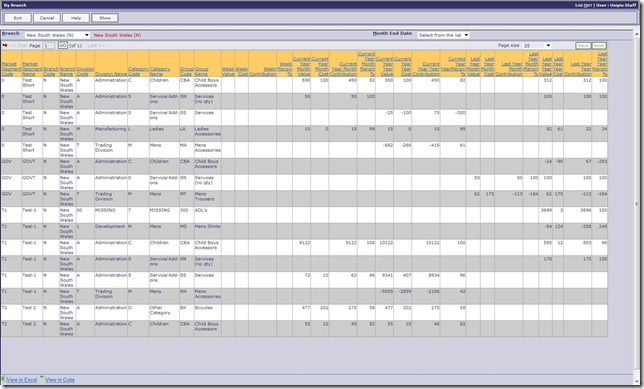
However the user can then decide to limit the details displayed and only show one Branch, excluding all other branch sales from the details displayed as follows:
As you can see, columns are shown for the following “actuals”:
- Week Actuals – Sales, Cost, Contribution, Margin/Mark-up
- Current Month Actuals – Sales, Cost, Contribution, Margin/Mark-up
- Current Year Actuals – Sales, Cost, Contribution, Margin/Mark-up
- Last Year Current Month Actuals – Sales, Cost, Contribution, Margin/Mark-up
- Last Year Actuals – Sales, Cost, Contribution, Margin/Mark-up
 The ability to choose a specific month to view is also available to users via a drop-down list of months for which sales “actuals” are held. There will be up to 25 months sales data to select from once history has built-up on your system.


