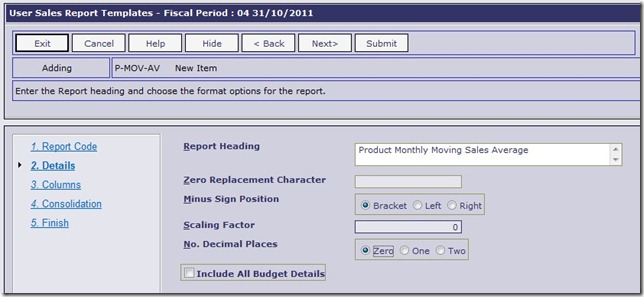
Creating User GL report templates is a fairly straight-forward activity with the setup tool that leads you through the questions required to write a report. The hardest part (as always with reports) is working out what you want to see, and in what sequence. Below is a step by step sample of some of the functions and features available when writing these templates to provide an overview of the potential. There is practically an unlimited number of different GL Reports that could be generated with this tool.
Step 1 – Details
Apart from giving the report a “heading” or name, there is nothing mandatory required at this step. However these features are provided:
- the ability to replace any zero’s with a word/character e.g. “*” or the word “Nil”
- Position/style of “negative” figures
- Scaling factors – great when you know you are going to have trouble fitting things on the page
- Decimal places – as with scaling, allows you to reduce the size of columns, or just simply the report
- Budgets – because merging budget figures into the analysis takes extra work we’ve made it optional so the system will not do it where not required. This also improves the reports running time for users
Step 2 – Columns
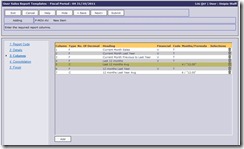 The “detailed” part of any report writing- the columns! Figuring out what columns to add in, where and in what sequence, and what “rules” are required for each column is where all the work involved in generating a useful template is. The sample here already has seven columns on the report as shown in the list, but how did they get there?
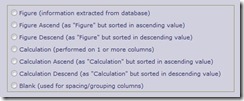 Clicking the “Add” button on the screen above take the user to this input step where they must select the type of column they want to add to the report. The column types available are shown along with an explanation as per the sample here.
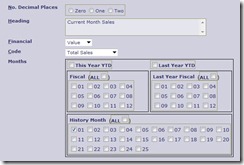 When you choose one of the “Figure” column types, you will be presented with selections along the lines of the sample provided here. Apart from being able to set a column heading and over-ride the number of decimal places, there are some important questions relating to the “Figures” that are to be shown in the column. Firstly, the “Financial” prompt allows the user to choose either sales “Value”, “Cost” of sales, or the “Quantity” sold.
The user can set the “method” of calculating these “Financial” figures from the list below:
- Budgets
- Gross Sales (Normal + Special)
- Normal Sales only
- Returns only
- Special Sales only
- Total Sales (Gross – Returns)
Finally the choice of which month or months need to be made. As you can see from the screen sample there are a number of ways to select the months to include. We have provided easy to use check-boxes so a user can select “This” or “Last Year” (YTD), or pick from the “Fiscal Months” or “Historical Months” available. Note: for the “Historical Months” it uses 1 for the current month, 2 the previous and so forth. We’re providing 25 months history so that you can write reports that show this month this year, this month last year, and this month the previous year to last.
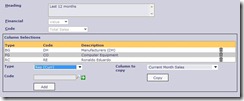 After entering this detail, the user moves on to the “Selections” sub-step. It is an entirely optional step, but is does give the “author” the ability to establish very specific rules about what “data” is included or excluded for the column. All the “elements” listed as being available to report on can be used here to filter the data used to calculate the figures for each column. There is even a handy “copy” tool so you can copy these rules from other columns to save having to set them up each time. Using these column based selections a user can create reports where each column then represents a “Branch”, or “Buying Group”, or “Sales Rep”. Even combinations of these can be written as per the screen sample.
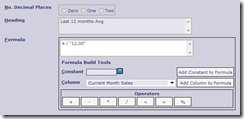 With the “Calculation” type columns a very different set of questions is asked. Specifically the user needs to set the how the figures in this column are to be calculated. The “formula” can be made with the use of references to the other columns on the report, an “operator” (add, subtract, divide etc.) and “constants” (e.g. the number “12” to divide an annual figure into a monthly average)
Step 3 – Consolidation
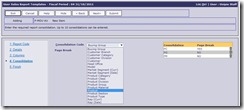 The final step in the process of creating a new report template is to nominate the “consolidations” required for the report. In essence this is where you can tell the system which detail is too appear on the report ”rows”. The options for consolidation are once again all the “data” elements previously listed (and shown in the diagram) and any combination of these may be employed. However given that there is an obvious structure to some things (like products) the hierarchy that is obvious is best followed i.e. Product Category sits above Product Group, and Product sits below Product Group. Using these consolidations determines which data will appear on the report and where, and also influence when a new page and totals will appear. The “1st” element listed is seen as the “Summary” item, and will be shown on a summary totals page at the end of the report. The “last” item listed is assumed to be the “detail” section. All other items are shown as totals within the report.
