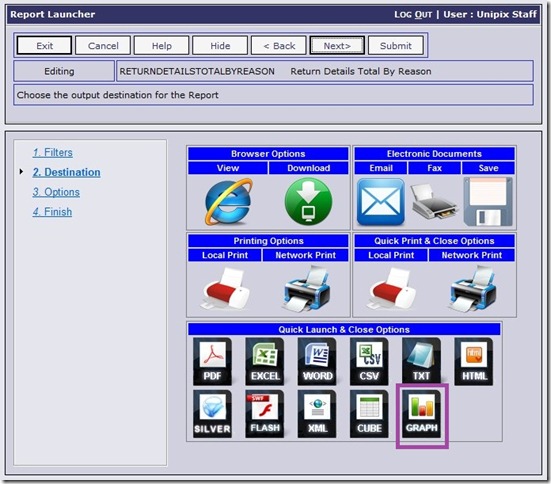
Online Advantage now has the ability to send report data to our new Chart Viewer for the display of data into a variety of user selectable graph formats. When running reports, the Report Launcher now has a “Graph” icon and option which will direct the date to the Chart Viewer. See sample screen shot below of the new Report Launcher:
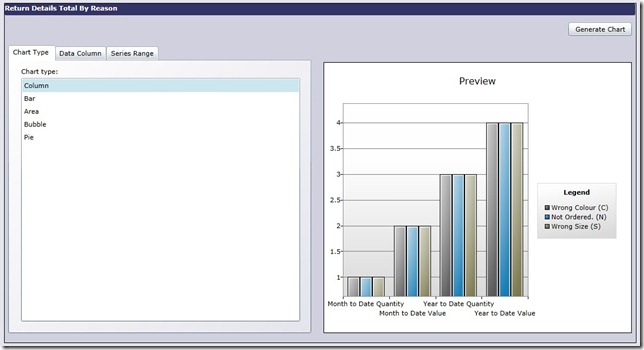
Once a report is directed to the new Chart Viewer the user will be presented with a screen that looks similar to the sample below:
As you can see, the following graph types have been provided:
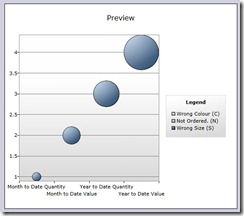
Note that as the user selects the type of graph they want to view the preview pane changes to give them an idea of the type of chart that will be shown. See sample of the Bubble Chart type shown here.
Almost all the standard reports in Online can now be directed to the Chart Viewer as opposed to the other display and print facilities that are standard features of the Report Launcher. Note however that not all of these options will be available for use on every report you run as the list will depend on the type of data available for use on a given report.
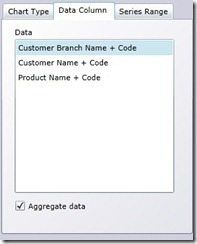 The “Date Column” tab shown here also highlights the ability to aggregate the data in the report. The data can be aggregated (added together) so that only totals are shown. Otherwise all the details of each item that would have appeared on the report will be shown on the graph.
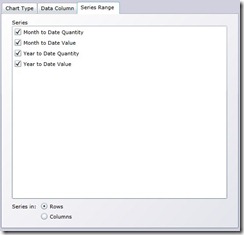 The user can select the “data” to be used as “values” on the chart, assuming there are multiple data items available for selection from the report used. Each item of numeric data on the report is made available for selection by the user as per the sample here. This means you can turn on and off the items as required to get the right balance on the chart with the data they are reporting on.
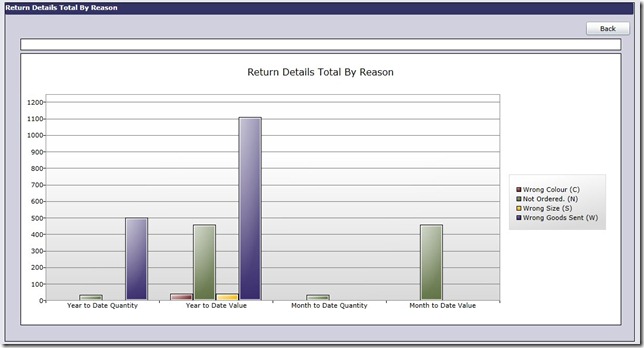
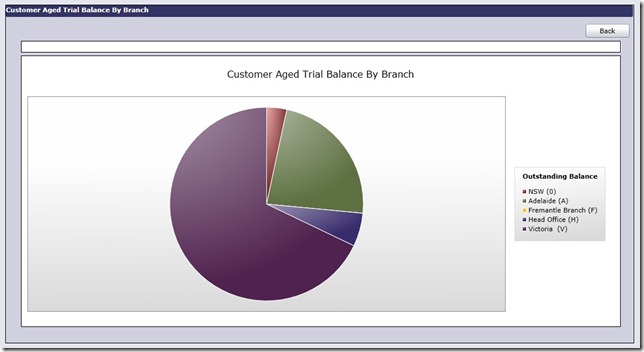
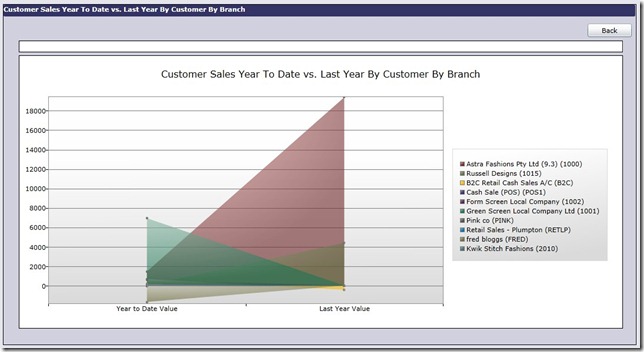
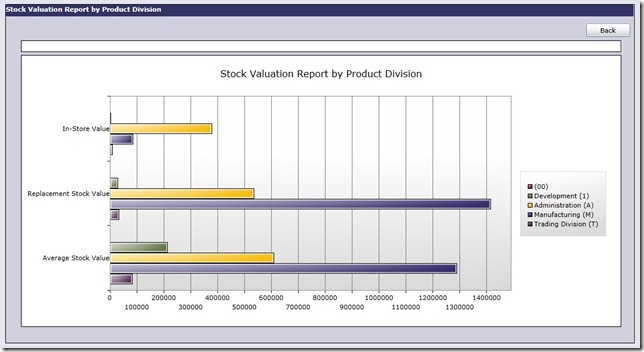
When the user is ready, they simply click the “Generate Chart” button and the full screen is used to show the chart with the details they have selected. See some samples below of different reports and chart types to give you a feel for the power of this feature:
